
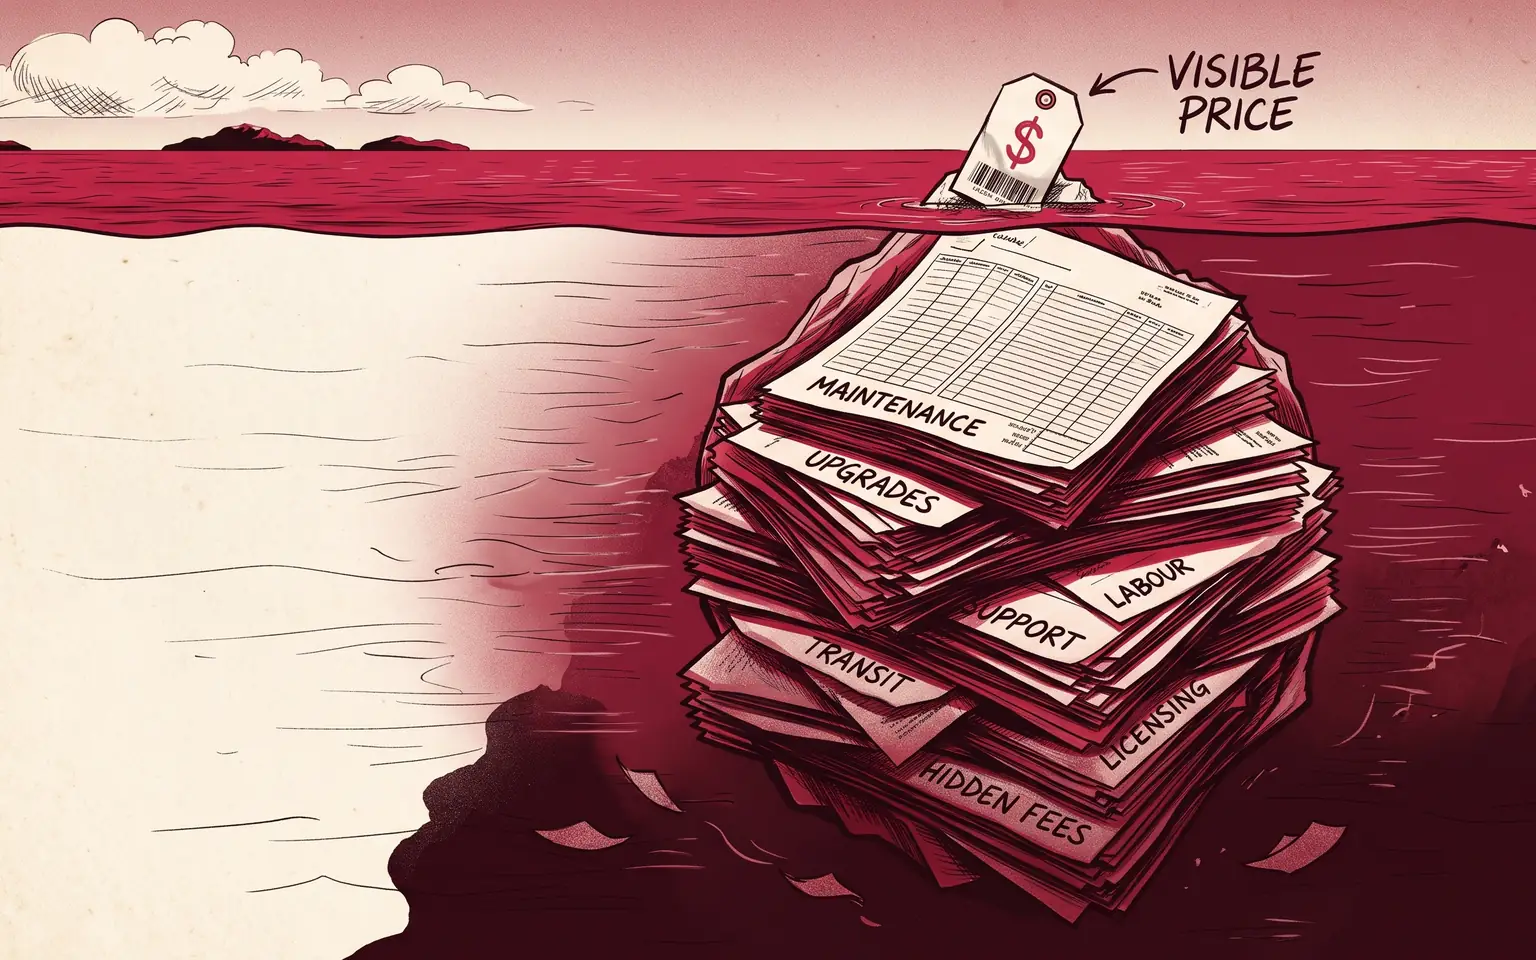
Almost every printer procurement process eventually narrows down to a single comparison number: cost per page. Vendor A quotes 1.8 cents per mono page. Vendor B quotes 1.4 cents. The procurement spreadsheet calculates the difference across projected annual volume and the cheaper vendor wins.
The problem is that cost-per-page is not actually a comparable number across vendors. It looks like one — same units, same decimal places, same simple multiplication — but it is constructed from a different set of assumptions by each supplier, and the assumptions are where most of the cost difference sits.
This piece explains what cost-per-page actually measures, why two seemingly comparable CPP figures can produce wildly different real-world costs, and what to track if you want a number that reflects what you will pay over a five-year contract.
What cost-per-page actually is
Cost-per-page is the rate the vendor charges the customer per A4-equivalent page produced on a device under contract. It is conventionally split into a mono rate (lower) and a colour rate (higher), with the colour rate covering both colour and mono pages in some vendors’ models and only true colour pages in others.
The figure typically includes some bundle of: toner, drums, service kits, parts, labour, software. Which of those are in the rate and which are outside it varies materially by vendor, by contract structure, and by what was negotiated.
What cost-per-page does not include, almost universally, is: device acquisition, freight on consumables to remote markets, downtime cost, helpdesk and IT staff time, software licences sold separately, parts on devices outside their standard service inclusion, end-of-life data sanitisation and disposal. Some of these get added to the contract as separate line items. Others land on the customer as one-off invoices over the life of the contract. Either way, the cost is real but does not appear in the cost-per-page rate.
This means the cost-per-page figure on a quote is, at best, a rate for part of the operational cost of the printer. The customer who compares two CPP rates and chooses the lower is comparing two partial rates that exclude different subsets of the actual cost.
The four ways cost-per-page gets gamed
In our experience, the cost-per-page on vendor quotes is influenced by four common practices that make direct comparisons unreliable.
Bundling that varies between quotes. Vendor A’s CPP includes service kits and labour; Vendor B’s CPP excludes them and charges them as a separate service contract. Vendor A’s CPP includes 5% surplus toner yield in the calculation; Vendor B’s CPP assumes nominal toner yield. Vendor A’s CPP excludes any colour-side coverage assumption; Vendor B’s CPP assumes 5% colour coverage and rates above that as additional pages. The numbers are calculated differently, and the comparison is structurally broken before procurement starts comparing.
Coverage assumptions that do not match real usage. Cost-per-page calculations rest on an assumed page coverage — typically 5% for mono and 20% for colour. If the customer’s actual coverage is higher (a marketing department printing brochures, a finance team printing full-colour reports), the effective cost per page goes up. Some vendors price assuming the customer will exceed the standard coverage; others price assuming they will not. Both will quote 1.8 cents per page; one of them is forecasting accurately and the other is not.
Minimum volume commitments. A low CPP rate often comes with a minimum-volume clause. If the customer’s actual print volume is below the commitment, they pay the per-page rate on the volume they committed to, not the volume they used. Two quotes with apparently similar CPP rates can produce materially different bills if one includes a 10,000-pages-per-month minimum and the other does not. The CPP looks the same; the customer’s exposure is not.
Excess-page rates. The CPP rate quoted in the contract applies to volumes inside a defined band. Volumes above the band — which procurement projections almost always underestimate — are charged at an “excess page” rate that is typically two to four times the headline CPP. Customers who exceed their committed volume routinely discover this only at month-end invoicing. The contract has not been violated; the higher rate was always there in the fine print. The CPP comparison at procurement time excluded the excess-page exposure.
Each of these four practices is legal, common and not generally signalled to procurement teams. Each one means the headline CPP is materially less informative than it appears.
What to track instead
The right number for procurement to track is the total bundled cost over the contract term, divided by realistic projected volume — not the headline CPP itself.
Concretely, ask each shortlisted supplier to provide:
- The total all-in monthly cost across the contract (device, consumables, service kits, parts, labour, software, freight) at a defined target volume.
- The same total at twenty percent below the target volume (the scenario where actual usage undershoots projection).
- The same total at twenty percent above the target volume (the scenario where usage exceeds projection, including any excess-page charges).
- The total mono and colour coverage assumed in those calculations.
- Any minimum-volume clause and the financial consequence of falling below it.
- Any cost lines the supplier expects to invoice separately over the contract term, with estimated frequency.
When these are laid out side by side across two or three suppliers, the comparison stops being a single-number exercise and becomes an honest evaluation of total exposure. The supplier with the lowest CPP rarely has the lowest total cost in this view; sometimes they do, but the answer is no longer guessable from the headline number alone.
How to use cost-per-page correctly
Cost-per-page is a useful number, but only at the right point in the evaluation.
It is not useful as the primary comparison metric across suppliers, because the bundled inclusions and coverage assumptions vary too much for the headline figures to be directly comparable.
It is useful inside a single supplier’s quote, as the rate the customer pays per page of the bundle the supplier has actually committed to deliver. Once a supplier is shortlisted and the inclusions and exclusions are fully understood, the CPP rate against the projected volume gives a clean monthly cost forecast that the customer can budget against and that the supplier can be held to.
The trap is using CPP as a proxy for total cost, or using it to compare structurally different proposals. Both are how procurement teams end up paying significantly more than the headline rate suggested, six to twenty-four months into a contract that looked great on the spreadsheet.
What this means in practice
The cheapest cost-per-page is the easiest single number for a vendor to put on a proposal. It is rarely the cheapest contract overall, and almost never the cheapest five-year cost.
Pacific buyers who run their procurement on CPP alone are not making a worse decision than buyers anywhere else — they are making the same mistake everyone makes, in a market where freight, downtime and parts availability amplify the mistake harder than elsewhere. The fix is to stop comparing single-number rates and start comparing total bundled cost against documented service commitments.
We put a five-year all-in cost figure on every contract we quote, including the freight, downtime, and parts assumptions specific to the market you are in. The figure is higher than a bare device-plus-CPP quote from a cheaper supplier — and lower than the actual cost most of those cheaper suppliers produce over the contract life, because the lines they left out land somewhere.
If you are evaluating printer suppliers right now and the proposals you have received are all single-CPP quotes, get in touch. We can produce a like-for-like all-in cost comparison against any specific competing quote, with our assumptions documented, before you commit to a contract.